Case study · 2025
Scaling HCD Through AI: Transforming Research Synthesis into Strategic Decision Support
How an automated synthesis pipeline reclaimed 80% of an HCD team's production capacity and created space for strategic facilitation.
- Client
- U.S. Navy
- Role
- Design Operations & Strategy Lead
- Governance
- OPNAVINST 1500
Overview
Moving from synthesis operators to strategy facilitators
In high-stakes environments like the U.S. Navy’s Learning Stack Quota Management, which plans training pipelines and sailor seat allocations, HCD teams often face "synthesis debt"—the crushing manual labor of reconciling raw research with process documentation. This bottleneck turns designers into documentarians, preventing them from driving strategic direction.
I led a strategic operational redesign by architecting an automated pipeline to handle the heavy lifting of aligning transcripts with our Process Map. By automating this synthesis, I reclaimed 80% of our team’s production capacity, allowing us to pivot from "Synthesis Operators" to "Strategy Facilitators" and move from raw data to a prioritized action plan in a single project cycle.
Client or context
Regulated policy met lived experience
Client: U.S. Navy
Year or timeframe: 2025
Governance: OPNAVINST 1500.47D. The project required reconciling complex, regulated policy documentation with real-world user research to surface hidden process bottlenecks.
Role and collaboration model
Design operations, strategy, and facilitation
Role: Design Operations & Strategy Lead.
I worked directly with policy stakeholders, regulatory auditors, and the research team to bridge the gap between "policy-as-written" and "policy-as-lived." My role was to architect the synthesis engine while facilitating the human-centered workshops that drove the final design strategy.
Challenge or problem
Synthesis debt created a strategic ceiling
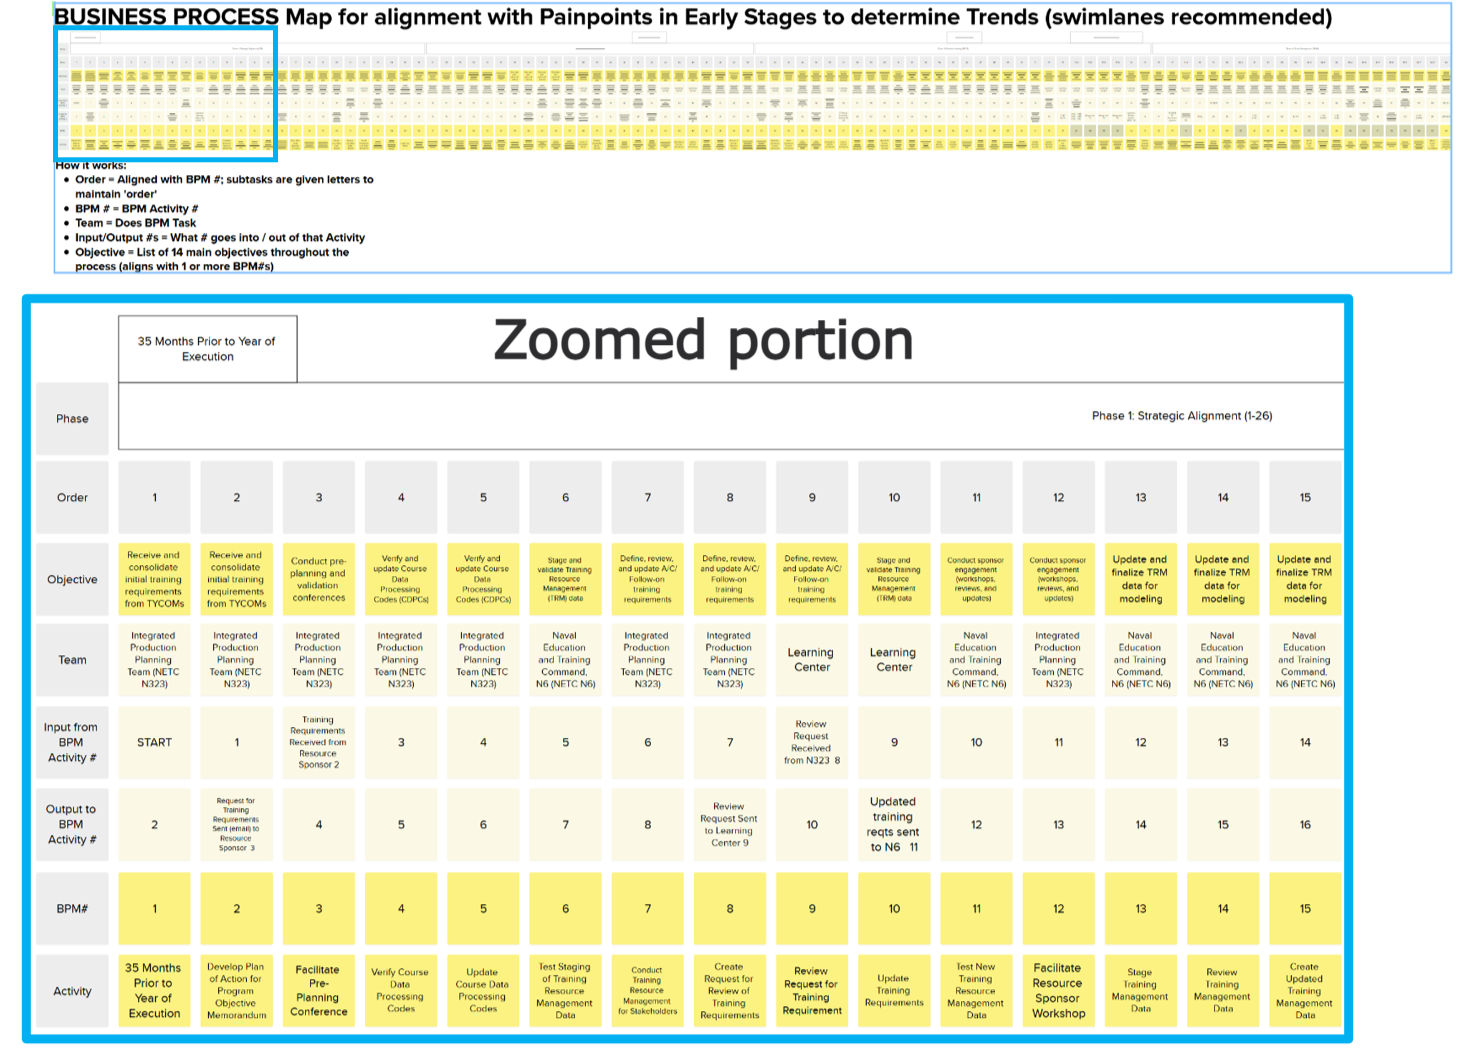
The team was trapped in "Synthesis Debt." We spent 80% of our capacity on the mechanical labor of formatting spreadsheets and cross-referencing thousands of transcript rows against a 121-step Business Process Map. This created a "strategic ceiling"—we were so busy documenting the problem that we had no bandwidth to facilitate the solution.
Inputs or research sources
Research and operating context
- Raw user interview transcripts.
- 121-row Business Process Map (BPM).
- Official policy documentation (OPNAVINST 1500.47D).
Workflow, process, or approach
An automation-first HCD velocity engine
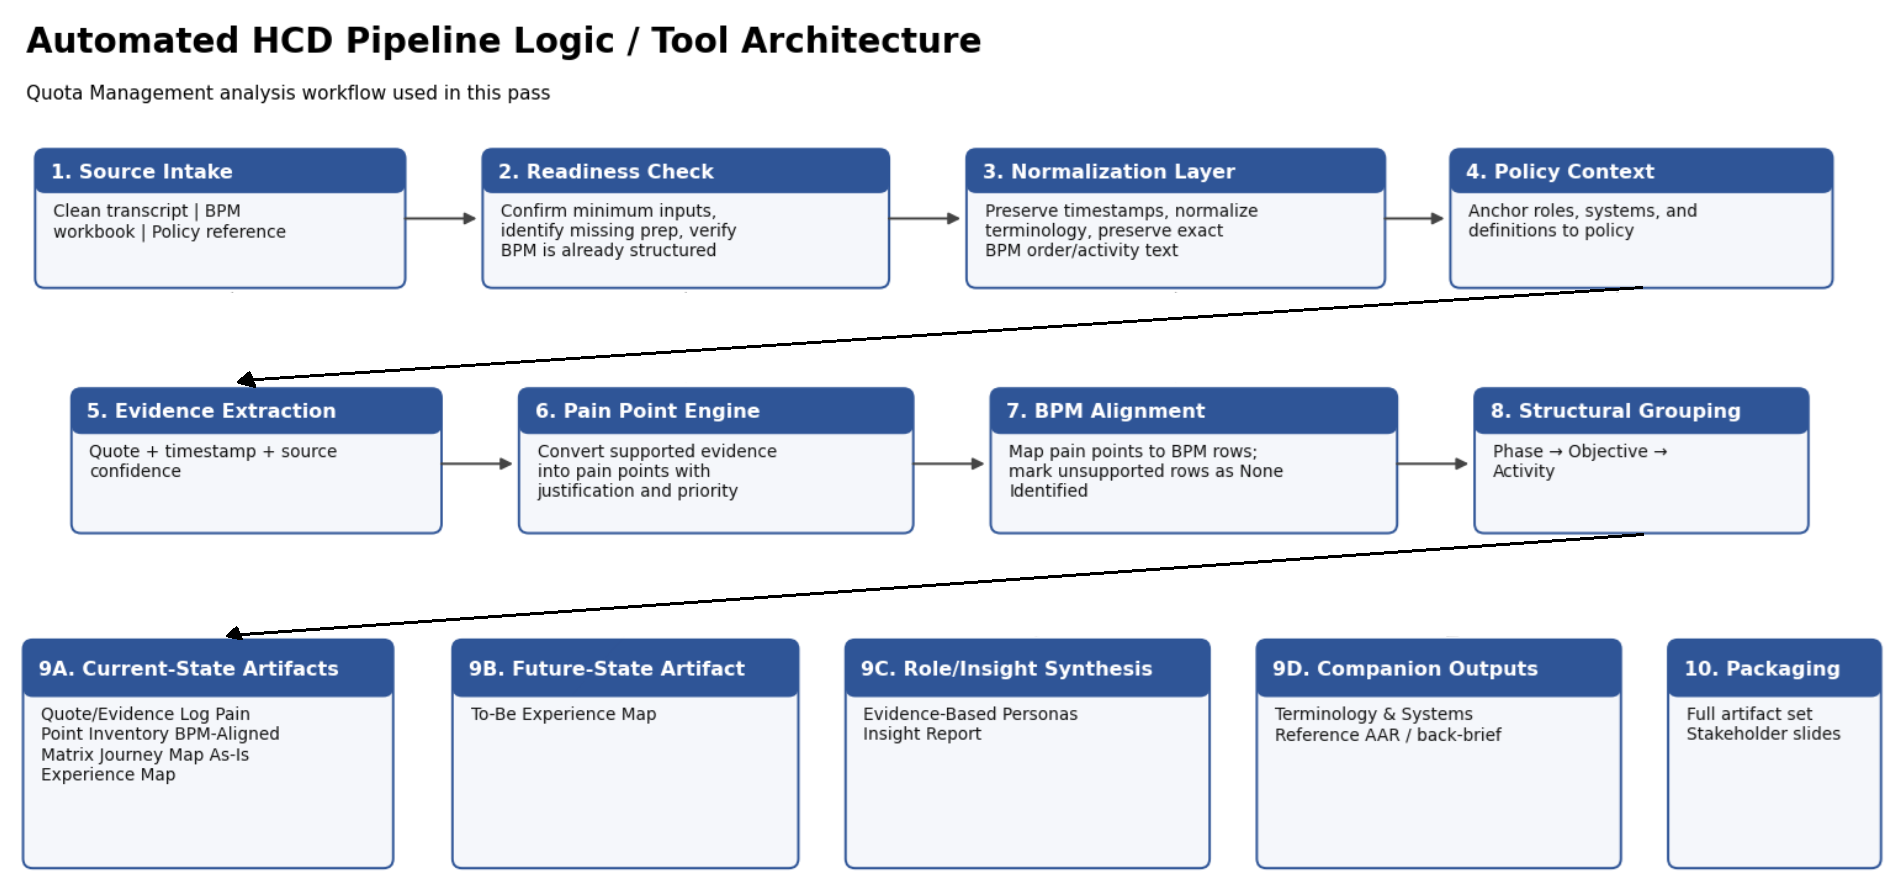
I architected an "HCD Velocity Engine"—an automation-first pipeline—that treated synthesis as a data-reconciliation challenge. By automating the alignment of transcripts to process steps, I moved the team away from manual spreadsheet manipulation and into direct artifact creation.
Research methods and synthesis
Evidence first, including where evidence was absent
We used evidence-first synthesis. The pipeline ingested transcripts and mapped them to specific BPM IDs. I introduced a "Source Confidence" metric: if the system found no evidence for a specific BPM step, it flagged the finding as "None Identified," ensuring all findings within our reports were rooted in high-fidelity data.

Design decisions, rationale, or logic
Reserve the human touch for judgment
I chose to automate synthesis because the bottleneck was process, not volume. My rationale was that the "human touch" should be reserved for shaping insights, crafting personas, and designing the To-Be roadmap, not for mechanical data wrangling.
Outputs and deliverables
From data processing to artifact creation
By offloading the mechanical synthesis to our automated pipeline, the team pivoted from "data processing" to "artifact creation."
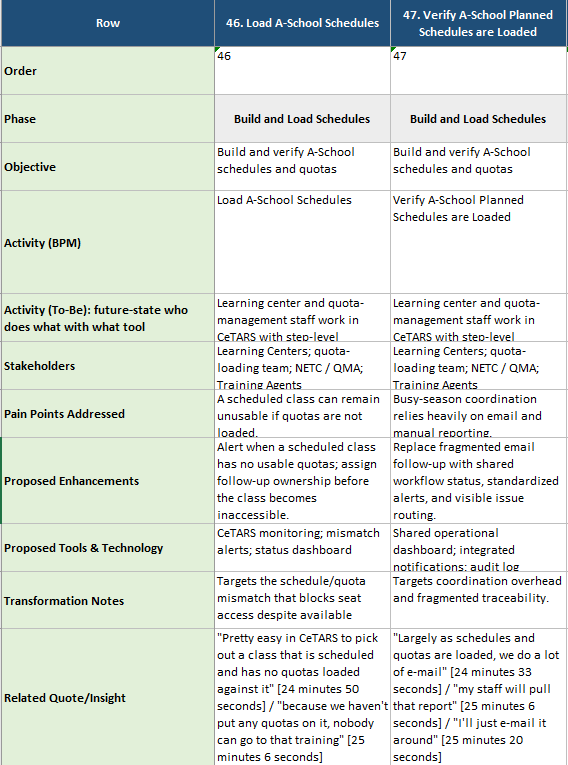
- Experience & Journey Maps: We visualized user friction against the 121-row BPM to identify specific, policy-driven bottlenecks.
- Data-Driven Personas: Generated directly from synthesized transcript data, ensuring profiles were rooted in actual behavioral evidence.
- Audit-Ready Insights Report: Our central "Source of Truth," pre-linked to transcript evidence and policy citations for full transparency.
- To-Be Map (Strategic Roadmap): Our critical deliverable: a future-state operational roadmap outlining the prioritized design interventions required to bridge fragmented processes and a compliant, user-centered model.
Accessibility considerations
Accessibility was part of the strategic output
In this regulatory environment, Section 508 compliance is a baseline, not an achievement. By offloading manual data reconciliation to the pipeline, I reclaimed the time necessary to integrate comprehensive accessibility guidance directly into our UX artifacts. Rather than treating accessibility as a compliance checkbox, I embedded technical requirements and inclusive-design guidance into our UX guidance, ensuring that our strategic insights were not only accessible to all users but also actionable for the development teams tasked with building them.
Measurable or observable impact
A measurable shift in capacity and velocity
- 80% Capacity Gain
- Manual production time was reduced by 80%.
- Strategic Pivot
- The team transitioned from "Synthesis Operators" to "Strategy Facilitators."
- Velocity
- We produced the full suite of artifacts in a single project cycle, maintaining audit-ready documentation without manual maintenance.
Why it matters
Design architecture creates operational runway
This project proves that the future of HCD is Design Architecture. By automating the "synthesis debt," I created an operational runway that allowed my team to shift from documentation to strategic planning. We moved from simply delivering reports to actively shaping the business strategy at a senior level.
Reflection
Design leadership includes designing the workflow
The most important lesson was that "doing it all yourself" is a strategic failure. By building systems that allowed for high-fidelity, evidence-based data, I learned that design leadership is about architecting the workflow so your team has the space to produce high-impact, user-centered artifacts.